Artificial Foreteller has a graphic user interface
that provides end user with charts and graphic interpretation of trade
prediction. Window consists of three basic components: bar chart,
stochastic chart, and legend. In the bar and stochastic components buy and
sell trade periods are shown with vertical strips different color. Right
most vertical strip defines type of next trade period. At the bottom of a
bar chart window there is a color bar that represent
result of trade prediction. Periods that are marked with red are not good
for trade. Periods marked with green color are good for trade, and periods
marked with yellow color denote that the system was not able to make
decision.
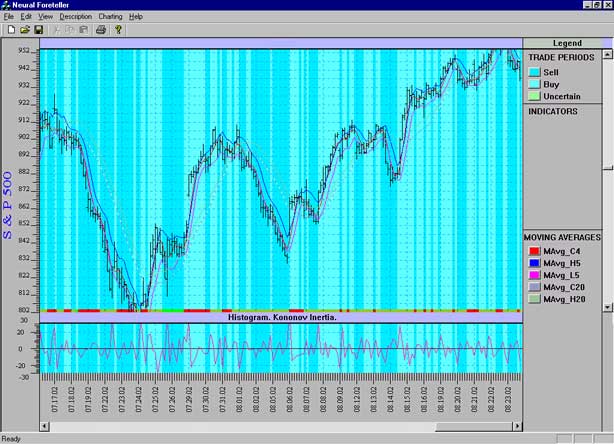
Artificial Foreteller provides end user with its
decision that end user can follow or not. At the same time the system
provides end user with chart full of usually used technical analysis
indicators such as Bollinger Bands, stochastics, relative strength index,
moving averages, and many others.
|
